
Do Prediction Markets Beat Polls? A 2026 Midterm Preview

Summarize this post
Key takeaways
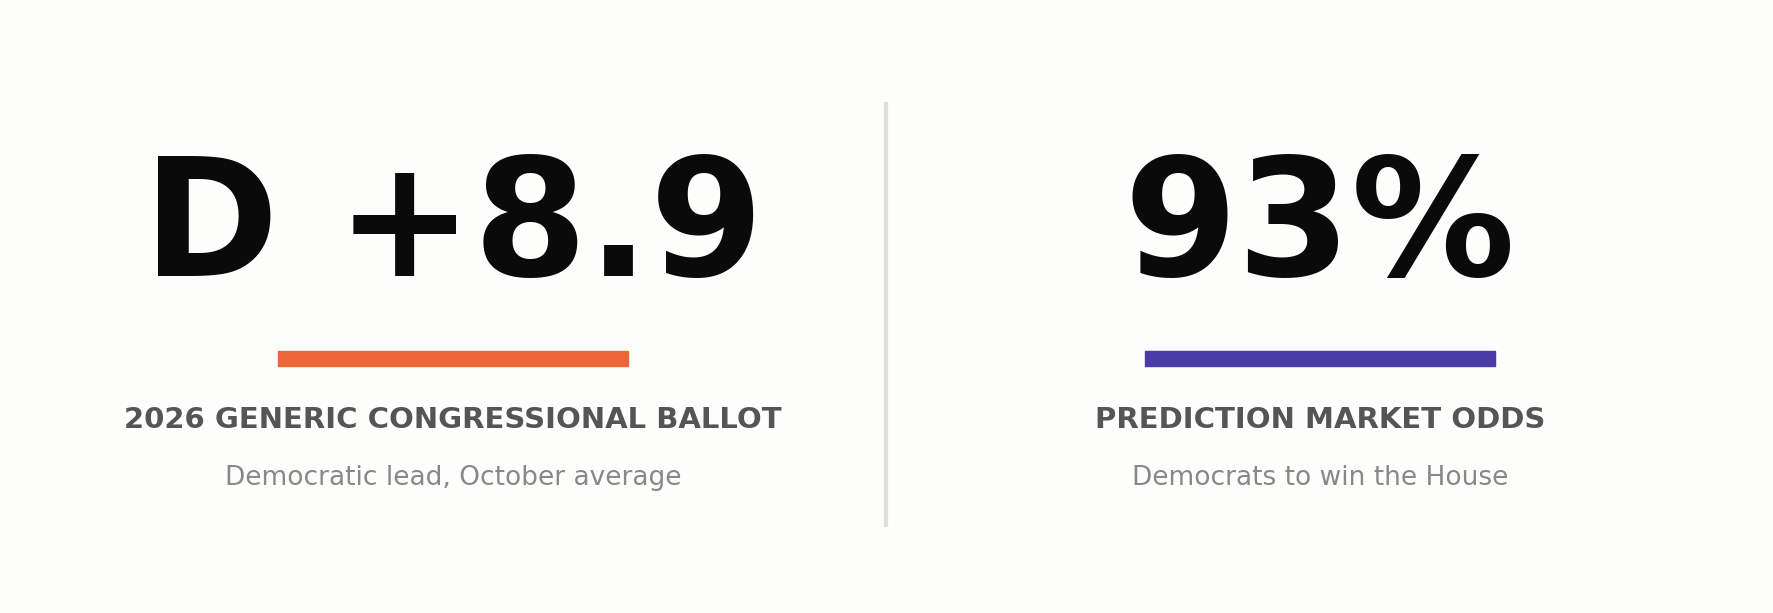
- The generic congressional ballot has Democrats up by roughly 9 points heading into the 2026 midterms, and prediction markets currently price Democratic control of the House at 93%.
- Iowa Electronic Markets beat matching polls in about 74% of comparisons across five presidential elections, but a widely cited 2012 study found markets added nothing once scientific polling became standard.
- A 2025 academic review found prediction markets tracked the 2024 presidential race about as well as statistical models nationally, but performed noticeably worse on down-ballot Congressional races.
- Market prices reacted within hours to real-time events in 2024, while polling averages took days to catch up.
- Accuracy varies sharply by exchange. One platform resolved about 93% of its 2024 election markets correctly, while another landed closer to 67%.
Both signals point toward a Democratic advantage heading into the 2026 midterms, but they measure very different things.
Heading into November, prediction markets put Democrats’ odds of winning the House at 93%, while the generic ballot has them up by about 9 points. Both point the same direction, but they get there through very different math.
Do Prediction Markets Beat Polls? The Short Answer
There isn’t a clean yes or no here, and you should be skeptical of any source that gives you one. The honest answer depends on the race, the time horizon, and what you mean by “accurate.”
Research on presidential elections is genuinely split. A 2012 study by political scientists Robert Erikson and Christopher Wlezien reviewed decades of election markets and concluded that once statistical polling matured in the 1930s, markets stopped adding any predictive edge over polls. On the other hand, an academic review of the Iowa Electronic Markets found the exchange beat the matching poll in roughly 74% of comparisons across five presidential cycles, a track record that helped build the case for markets in the first place.
The 2024 election added a more recent data point, and it cuts both ways. A 2025 analysis led by economist Rajiv Sethi found that Polymarket’s national forecast for the popular vote and Electoral College landed about in line with standard statistical models, not meaningfully ahead of them. But the same research found markets performed considerably worse than the models down the ballot, particularly on Congressional races, where trading volume and public attention are thinner. A separate study using Bayesian time-series modeling reached a more favorable read on markets, concluding that Polymarket’s pricing was ahead of the polling averages in several swing states before Election Day and reacted faster to campaign events.
Put simply, prediction markets and polls have each won and lost this argument depending on which election, which race, and which researcher you ask.
Markets and Polls Aren’t Measuring the Same Thing
Part of why this comparison is so hard to settle is that the two tools aren’t built to answer the same question. A poll asks people what they currently think or intend to do and reports it as a snapshot of opinion at that moment. A prediction market asks traders to put money behind what they expect to actually happen, and reports the current price as a probability.
Pew Research’s Courtney Kennedy has made this distinction directly, telling Undark she never uses prediction markets to understand public opinion because she would rather rely on rigorous data from the public than on people’s guesses about it. Polls gauge sentiment at a point in time, while markets are a forecast of a future outcome shaped by whoever is willing to bet on it. That difference matters because the people trading on a prediction market are not a representative sample of voters. Trading populations on most exchanges skew younger and more male than the electorate itself, and a small share of highly active traders account for a disproportionate share of total volume and profit. Polls, whatever their flaws, are built and weighted specifically to represent the voting population; markets are not designed to do that at all.
Where Prediction Markets Have the Edge
The strongest case for markets shows up around news events, not steady-state races. In 2024, prediction markets moved within hours of the presidential debate, the assassination attempt on Donald Trump, and Kamala Harris entering the race, while polling averages needed several days of new surveys to catch up to the same shift in the public mood. If you want a read on how a specific event is landing in something close to real time, a liquid market will usually get there before a poll does.
Markets also have a mathematical advantage when you combine them with other signals rather than picking one or the other. Researchers at UCLA’s Anderson School built a forecasting model blending polling averages, prediction market prices, and economic indicators, and found that polls and markets tend to make different kinds of errors that aren’t correlated with each other. Combining the two produced a more reliable forecast than either alone, and the same research showed that how you account for state-by-state correlations matters just as much as which inputs you use. Their blended model put Trump’s win probability at 72.6% once state outcomes were treated as correlated, versus nearly 90% when they weren’t, a reminder that methodology can move a forecast as much as the underlying data does.
Where Polls Still Have the Advantage
Markets tend to lose their edge exactly where you’d expect: races with thin trading volume and low public attention. Down-ballot Congressional contests get a fraction of the volume that a presidential race attracts, which widens spreads and leaves prices more exposed to a single large trader than to broad, informed consensus. That’s consistent with the 2025 finding that markets underperformed statistical models specifically on Congressional outcomes.
Markets also carry a well-documented long-shot bias, where bettors tend to overpay for underdogs in winner-take-all setups, a distortion that a properly weighted poll doesn’t have to correct for. And accuracy is far from uniform across platforms. Looking back at 2024, one exchange resolved roughly 93% of its election markets in line with the eventual outcome, while another came in closer to 67%, with real gaps in liquidity and pricing efficiency behind that spread. Researchers have also found pricing inconsistencies between exchanges on the very same contracts, including arbitrage gaps that persisted rather than closing as Election Day approached, which is the opposite of what an efficient market is supposed to do.
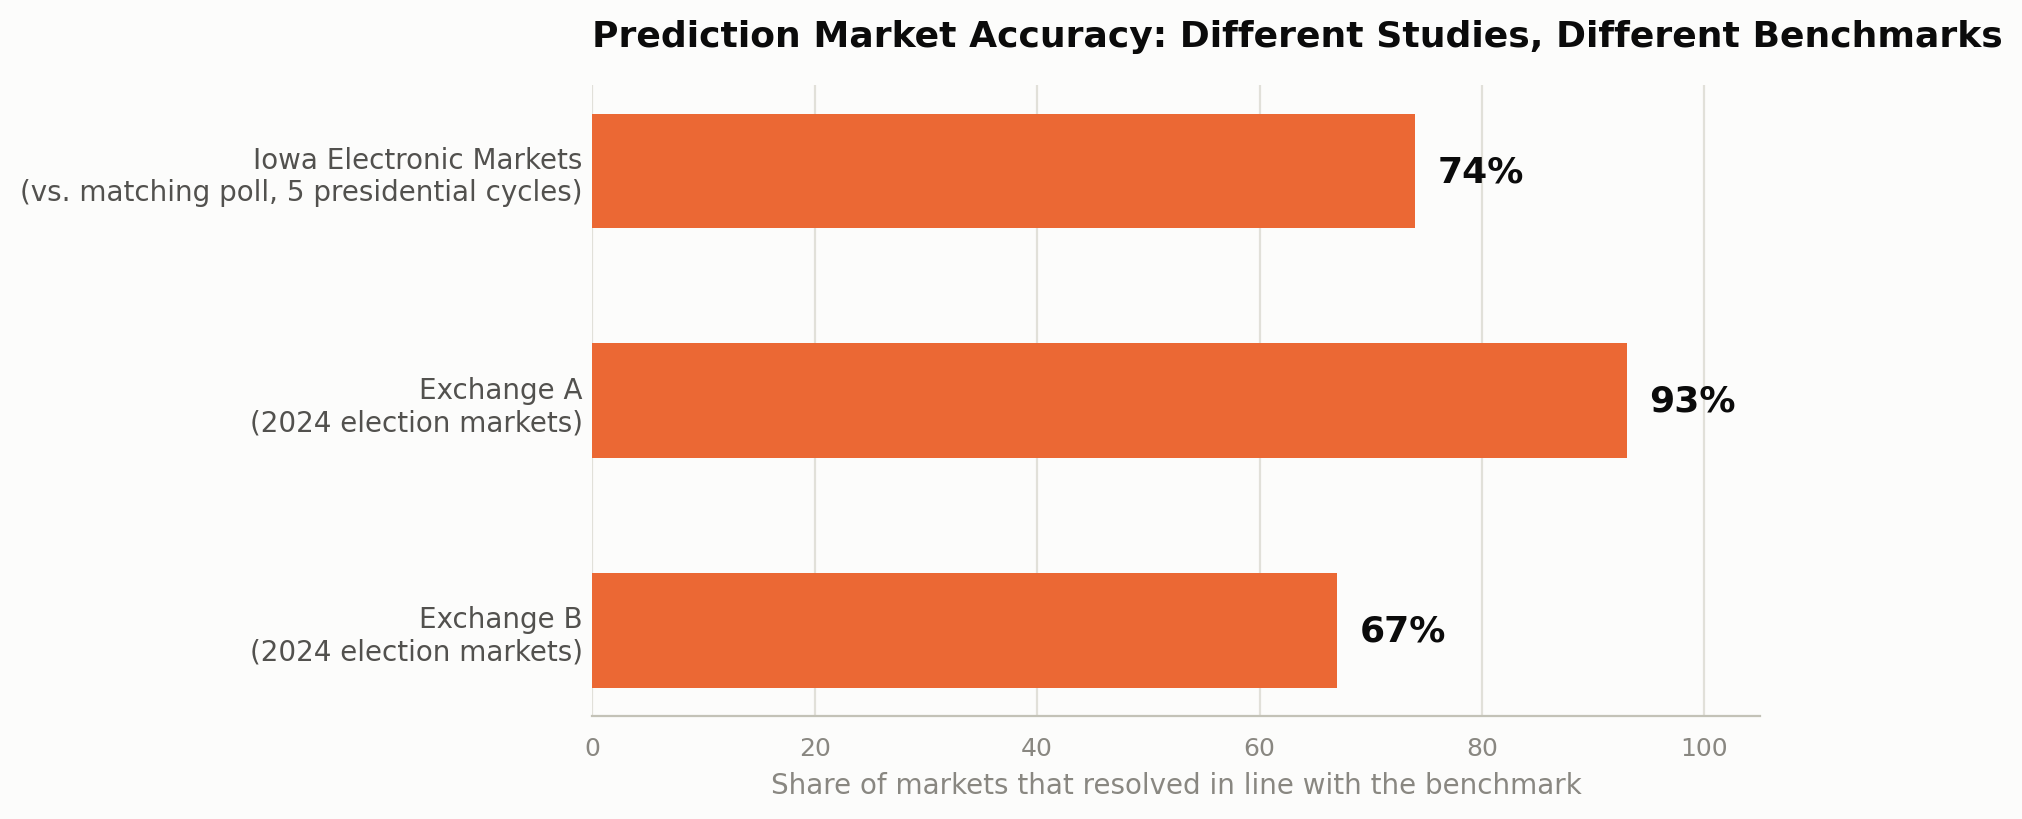
Three separate track records, measured against two very different benchmarks.
Prediction Markets vs. Polls at a Glance
| Prediction Markets | Polls | |
| What it measures | Traders’ forecast of the outcome | Respondents’ current opinion |
| Speed | Reacts within hours to news | Takes days to reflect a shift |
| Best suited for | High-attention, high-volume races | Any race, including down-ballot |
| Main weakness | Thin volume and long-shot bias | Sampling and response-rate error |
Prediction market pros
- Reacts within hours to breaking news
- Puts real money behind the forecast
Prediction market cons
- Thins out badly on down-ballot races
- Skews toward a younger male trader base
Polling pros
- Built on weighted representative sampling
- Covers every race on the ballot equally
Polling cons
- Slower to reflect a sudden news shift
- Can undercount historically hard-to-reach voters
The 2026 Midterms: What Both Signals Say Right Now
With Election Day set for November 3, this is exactly the kind of race where it helps to check both signals rather than picking one. As of early October, Silver Bulletin’s generic congressional ballot average has Democrats up 8.9 points, a cycle high that includes breaking 50% support for the first time. Adjusting for likely voters pushes the Democratic edge to 9.6 points. That gap is showing up alongside a president’s net approval rating sitting near all-time lows, around -22 in Silver Bulletin’s average, a combination that has historically pointed toward a rough midterm for the party in the White House.
Prediction markets are reading the political environment and pricing it even more one-sided. Current odds put Democratic control of the House at 93%. Look at full chamber control together and the picture gets more specific: markets currently price a full Democratic sweep of the House and Senate at 65%, a split Congress with Republicans holding the Senate and Democrats the House at 28%, a full Republican sweep at 8%, and the reverse split at under 1%.
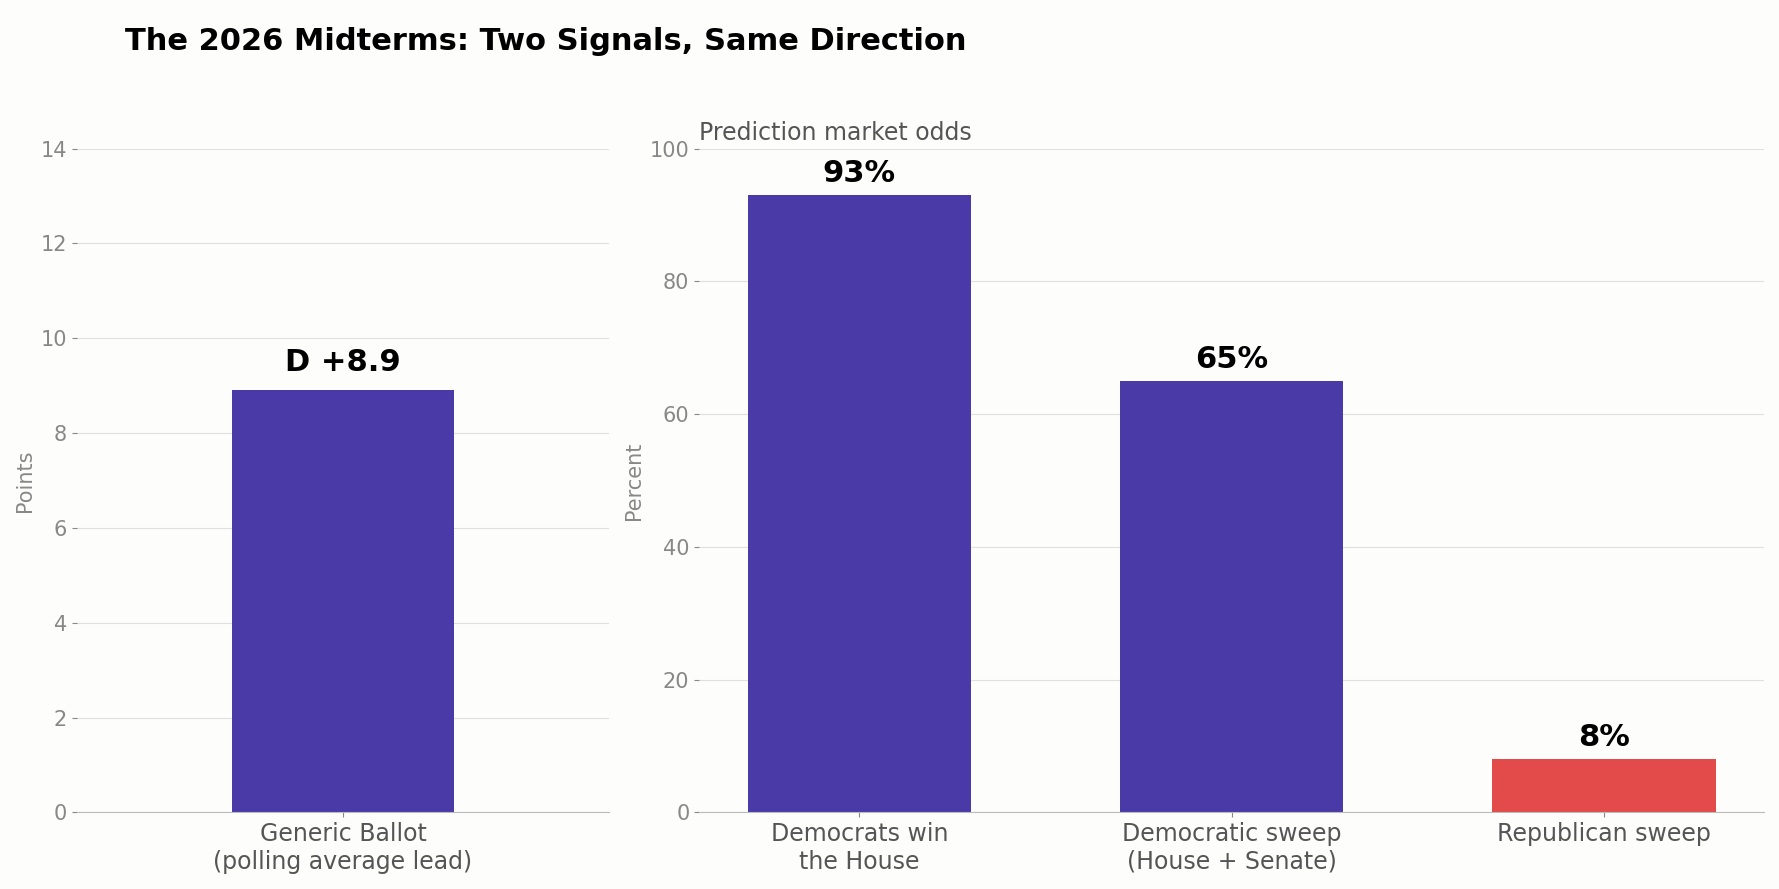
Polls and markets now both point firmly toward a Democratic House, with markets pricing it as close to a lock.
The two signals are closer than they were a few weeks ago: a roughly 9-point generic ballot lead and a 93% market price tell a similar story. Any remaining gap isn’t necessarily markets being wrong. Chamber control depends on how a national margin translates seat by seat, not just the topline number, and traders are effectively pricing in redistricting, retirements, and district-level competitiveness that a single national poll can’t capture. It’s also exactly the kind of divergence worth watching over the next four weeks. If the generic ballot margin narrows while the market’s confidence holds steady, or the other way around, that gap is often more informative than either number sitting still.
How to Read Both Signals Without Overreacting to Either
Treat the generic ballot as a read on the national mood, not a seat count. It tells you which way the wind is blowing, not how many districts flip. Treat market prices as the current cost of a bet, not a certainty, especially on any contract with light trading volume where a single large position can move the number. When the two are telling a similar story, that’s a reasonably strong signal. When they start to diverge, it’s worth asking what one side might be pricing in that the other hasn’t caught up to yet, rather than assuming one of them is simply broken. It is also worth comparing prices at different platforms. Are, say, Polymarket and DraftKings Predictions paint the same picture?
Both tend to sharpen as Election Day gets closer, so a gap you notice in early October is more of a preview than a verdict. Check back on both numbers periodically between now and November rather than anchoring on a single snapshot.
What Our Expert Says
“I look at the generic ballot for the big picture and prediction markets for how fast the world is reacting to news. Neither one is a crystal ball by itself, but when they start moving in opposite directions, that’s usually the moment worth paying attention to.” – Chris Jonat
Frequently Asked Questions
Do prediction markets beat polls at predicting elections?
It depends on the election and the race. Historical research on presidential races is mixed: one long-run study of the Iowa Electronic Markets found it beat matching polls about 74% of the time, while other research found markets added no edge over polls once modern statistical polling took hold. In 2024, markets performed about the same as statistical models nationally but worse on down-ballot races.
Are prediction markets more accurate than polls in 2026?
There’s no way to know yet, since the 2026 midterms haven’t happened. What’s clear right now is that both signals point toward a Democratic advantage, with the generic ballot showing roughly a 9-point lead and markets pricing House control at 93% for Democrats.
What do prediction markets say about the 2026 midterms?
As of early October, markets price Democratic control of the House at 93%. Looking at full chamber outcomes, a Democratic sweep of the House and Senate sits at 65%, a split Congress with a Republican Senate and Democratic House at 28%, and a full Republican sweep at 8%.
Why do prediction markets and polls sometimes disagree?
They measure different things. Polls capture what a representative sample of people currently think or intend to do. Markets capture what traders are willing to bet will actually happen, filtered through trading volume, liquidity, and a trader base that skews younger and more male than the electorate.
Should you trust prediction markets over polls?
Neither should be trusted in isolation. Research combining polling averages with market prices found the two tend to make different, largely unrelated errors, which means pairing them produces a more reliable read than leaning on either one alone.
When do prediction markets tend to outperform polls?
Markets tend to do best in high-attention, high-volume races and around specific news events, where they can reprice within hours. They tend to do worst in down-ballot races with thin trading volume, where a handful of large trades can distort the price.
Sources
- Erikson, Robert, and Christopher Wlezien, “Markets vs. polls as election predictors: An historical assessment,” Electoral Studies, 2012
- Berg, Nelson, and Rietz, “Prediction Market Accuracy in the Long Run,” International Journal of Forecasting, 2008
- Sethi, Rajiv, et al., 2025 analysis of Polymarket’s 2024 U.S. election forecasting performance versus statistical models
- Chernov, Elenev, and Song, UCLA Anderson Review, “Prediction Markets + Polls + Economic Indicators: Better Election Forecasting?”
- Undark, “Prediction Markets Aren’t Likely to Replace Polling,” May 2026
- arXiv, “Are Betting Markets Better than Polling in Predicting Political Elections?” 2025
- Good Authority, “The perils of election prediction markets”
- Nate Silver, Silver Bulletin, 2026 generic congressional ballot average
- FiftyPlusOne, 2026 generic ballot polling average
- Polymarket, “Balance of Power: 2026 Midterms” and “Which Party Will Win the House in 2026” markets