The Best Cities for Pumpkin Doorstep Survival, Index
Summarize this post
The mornings are hinting at frost, the NFL regular season is a third of the way complete and Taylor Swift has released a new album; it can only be Halloween.
Have you already been pumpkin picking ‘for the gram’ at a local farm? Maybe you’ve already delicately placed Jack O’Lanterns on your doorstep.
Assessing some key metrics required for pumpkin survival, we analyzed 50 of America’s most populated cities, using a weighted index based on the following essential factors:
- Weather (humidity, rainfall and general temperature)
- Crime (amount of property crime per 100,000 residents)
- Pest control (cities with the most rodent call outs)
- Halloween ‘seasonal’ popularity (based on searches and trends)
Wondering how long your pumpkins might last outdoors? Our index reveals the areas where they’re most likely to remain boo-tiful, and the cities where you could face a mushy doorstep horror.
Key Findings:
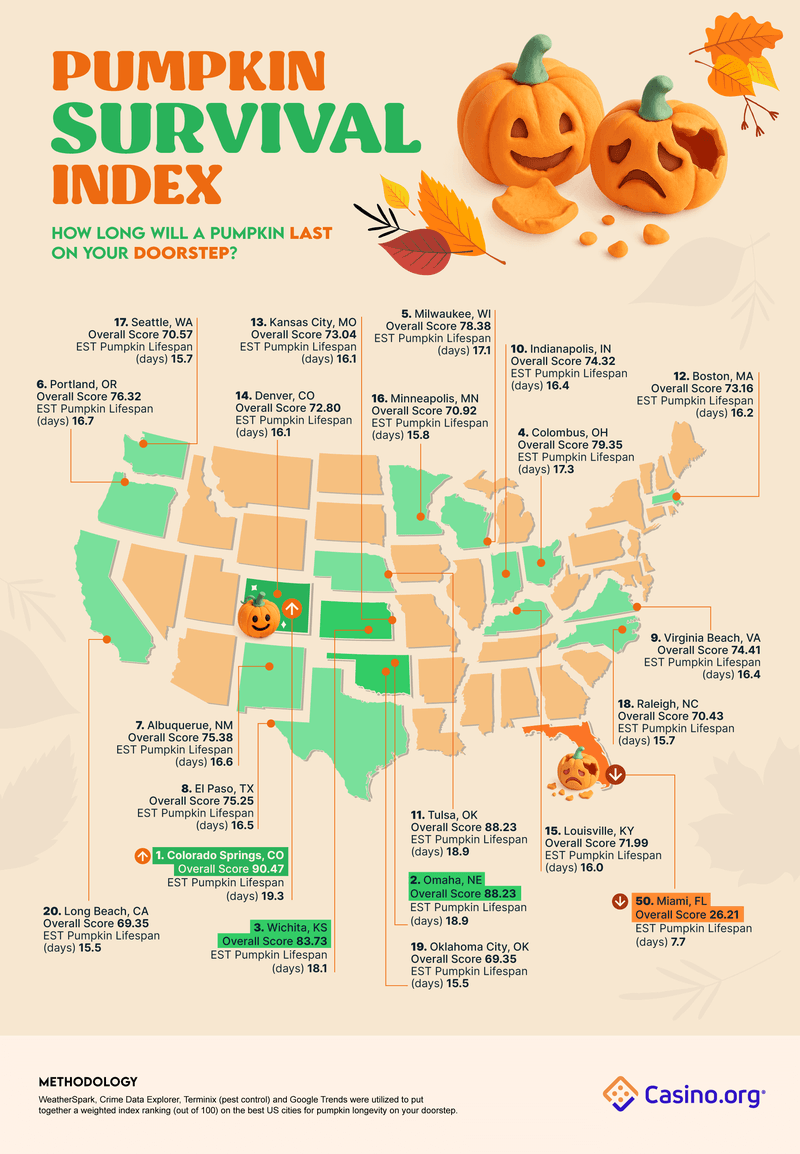
- Colorado Springs, CO, carved out a narrow success, ranking as the best city for Pumpkin Survival, scoring a spine-tingling 90.74/100.
- Omaha, NE, squashed most of the opposition, following in 2nd place with a score of 88.23/100.
- It was a smashing result for Wichita, KS, in 3rd position. An overall score of 83.73/100 put it ahead of Columbus, OH (4th, 79.35/100) and Milwaukee, WI (5th, 78.38/100).
- Pumpkins in Miami, FL have a frightfully short shelf life. ‘The Magic City’ finished last in the study, scoring just 26.21/100.
Top 20 cities for Pumpkin Survival

With stunning scenery, hikes and road trips across Colorado Springs, CO, it can now add pumpkin survival to an ever-growing list of Fall benefits, scoring 90.74/100.
Featuring an average temperature of 66 °F, low property crime rates (positive score of 65.69/100) and one of the lowest pest control callouts across the US, Colorado Springs is the perfect place to start decorating early. According to our data, an uncarved pumpkin could last for 19.3 days on the doorstep in the city.
Perhaps surprisingly, Omaha, NE, claimed 2nd position ahead of a host of bigger name cities, totalling 88.23/100. Temperature was the key weighting within the weather component of our study, and an October average of 72 °F was a key reason for Omaha’s inclusion. With a lack of rodent visitors, a low property crime rate (70.56/100) and high searches for Halloween events (88/100), Nebraska is one of the places to be this Halloween.
Wichita, KS, completed the top three with an overall tally of 83.73/100. Despite losing a few points due to a higher average October temperature, Wichita prospered in our seasonal popularity category. ‘Cowtown’ residents scored a perfect 100 in this category, one of only three cities in the ranking to record the maximum figure for Google Trends searches around the topic of Halloween.
Columbus, OH, topped the battle of the Ohio cities with a respectable 79.35/100, ranking particularly well for low property crime rates and cooler October weather, although with a mid-range ‘pest’ score, some pumpkins in Columbus might not make it unscathed until the final day of the month. Milwaukee, WI, completed the top five (78.38/100).
Looking at the worst cities for Pumpkin Survival, and unfortunately for Floridians, Miami, FL, ranked last (26.21/100).
With temperatures regularly in the 80s throughout October, one of the higher property crime rates in the study (76.89) and a lack of interest amongst residents compared to most cities (62/100 via Google Trends), pumpkins are estimated to survive just 7.7 days in the build-up to Halloween; that’s 2.5x less time than table-topper, Colorado Springs.
Conclusion
Whether you’ve already decorated for Halloween or planning on shutting the curtains to avoid trick-or-treaters on the 31st, our helpful index is here to show you how long your pumpkins might last this month. From the Rockies of Colorado to the Heat of Miami, some cities are just luckier than others.
Methodology
In October 2025, we began with a seed list of the 50 most populated US cities. An index was then created using the following metrics:
- Weather (temperature, humidity, rainfall) 25% – *although temperature was ranked the key metric here and handed a 0.9 rating, with humidity at 0.05 and rainfall at 0.05). Particularly hot cities were penalized accordingly in the study.
- Property crime rates 25%
- Pest control (cities with the most callouts for rodents) 25%
- Seasonal Popularity (cities searching for Halloween events the most) 25%
A weighted ranking was then crafted, with each city handed a score out of 100 and an estimated number of days the pumpkins could survive outdoors.
Sources:
- Weather Spark
- Crime Data Explorer
- Terminix
- Google Trends
Fair use
Feel free to use the data or visuals on this page for non-commercial use. Please be sure to include proper attribution linking back to this page, to give credit to the authors and researchers.


